How Much Light is Needed?
Few scientists who are including photochemical reactions in their synthesis make the actual photon flux known. Yet it is a key component to successfully reproduce published experiments from the scientific literature because of the variety of photochemical instruments and homemade setups available. Additionally, not quantifying photon flux makes it more difficult to translate from screening scale photochemistry to production scale photochemistry. Therefore, it is essential that photochemistry scientists are measuring, understanding, and reporting how much light is needed to perform a photochemical reaction.
Previously, we have discussed why and how you should evaluate light sources for your photochemistry experiments. While we touched on actinometry and the importance of calculating photon flux, this post is intended to provide details on how we perform actinometry measurements for our photoreactors which enables you to then determine the quantum yield in your photochemical reactions.
The methods described below can be applied for any photoreactor as a common solution to measure a light source’s intensity that penetrates a reaction vial. The collected data allow you to investigate kinetic reactions properly and to determine the quantum yield of a photochemical reaction.
The key takeaway is that photon flux intensity depends on a number of factors including: the light source (power, spectrum), the reaction vial’s position and shape, and the reaction volume.
Determine photon flux using actinometry
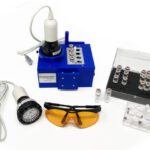
There are numerous actinometers that have been described in literature.1,2,3 Ferrioxalate complex is a versatile actimeter with an active rangefrom 250 nm to 500 nm.4 Because ferrioxalate becomes light sensitive as soon as it is in solution, actinometry experiments must be done in a completely dark room. However, the solution is stable if kept in the dark. The reaction vial is then irradiated by the light source and a sample is taken every 5 or 10 seconds. To facilitate sampling, the light source can be switched on and off during the experiment. Finally, each sample is treated with a phenanthroline solution to generate a Fe2+/ phenanthroline complex and the resulting Fe2+concentration can be determined using a calibration curve.
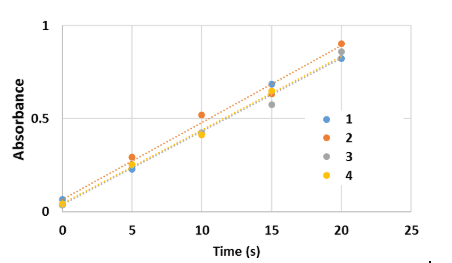
Above is a standard correlation between light absorbance and time exposed to the light source
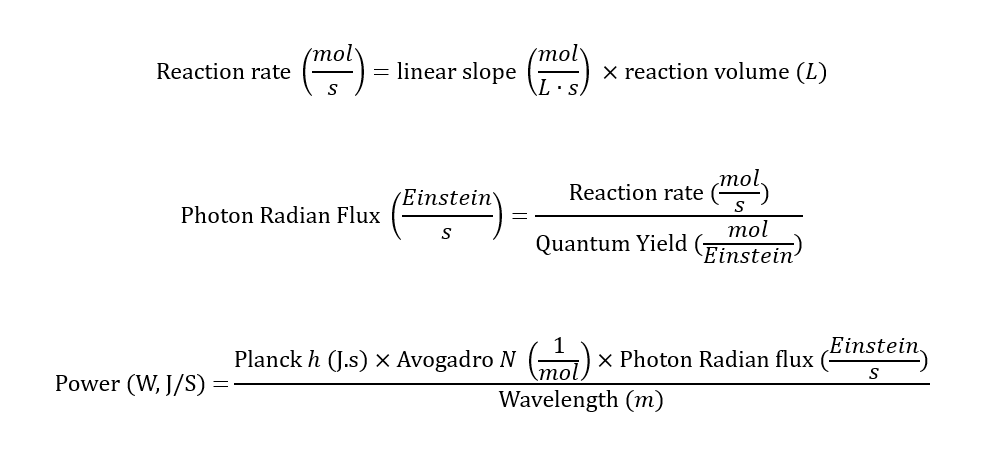
The increase of Fe2+ concentration is proportionate to the amount of photon absorbed and the slope of the line allows you to determine the rate of Fe2+ formation in mol/s. Accordingly, the photon radian flux in Einstein/s(the einstein is a unit defined as the energy in one mole of photons) can be determined using the quantum yield of ferrioxalate at the specified wavelength. Finally, Planck’s law allows us to determine J/s= W absorbed by the reaction solution. We have performed this measurement with concentrations diluted 4x and did not observe lower intensity readings. Therefore, we can conclude that all photons penetrating the solution are captured by the actinometer as concentration is not a limiting factor. See the formulas used for the calculations below:
Actinometry Measurement Formulas
Experiment 1: Distance vs photon radian flux
In this experiment, we determine photon flux using actinometry of a 2 ml actinometric solution in a 4 ml vial at 0, 5, 10, 15, and 20 cm from a light source. We used 2 light sources to compare efficiency: a Kessil 150 blue 34W (40 degrees of angle) and an EvoluChem 450nm 18W (25 degrees of angle).

The actinometry measurement results (shown in the graph below) illustrate that small differences (just a few centimeters) in the position of the reaction can make the power decrease 2 to 5 fold. Also, a narrower beam angle makes a 18W light more efficient than a 34W light.
Small differences in the distance of the reaction from the light source, as well as the beam angle of the light source, can have significant impacts on the photon flux
Experiment 2: Photon radian flux using different lights or vials
Here, we determine photon flux using actinometry using different vial sizes, reaction volumes, photoreactors and light sources. The table shown below illustrates the effective power received by the reaction depending on the setup. As you can see, a configuration with a 34 W light source (Entry #2) may only receive 0.16W effective power while a different configuration (Entry #3, with a more focused light beam angle) may receive up to 0.45 W effective power. Also, it is remarkable to note that the effective power received by a 4ml vial using a 450 nm 18 W EvoluChem light source at room temperature (Entry #1) is practically unaffected by the water-regulated 4ml vial using the same light source (Entry #4). The difference in effective power is essentially negligible at 0.03 W.
| Entry | Reaction Volume | Instrument | Reaction vial | Light source | Effective Power | Effective power per volume |
| 1 | 2 ml | Photoredox Box | 4 ml vial | 450 nm 18W EvoluChem | 0.35 W | 0.18 W/ml |
| 2 | 2 ml | Photoredox Box | 4 ml vial | Kessil 150 Blue 34W | 0.16 W | 0.08 W/ml |
| 3 | 2 ml | Photoredox Box | 4 ml vial | 450 nm 30W EvoluChem | 0.45 W | 0.23 W/ml |
| 4 | 2 ml | Photoredox TC 25C | 4 ml vial | 450 nm 18W EvoluChem | 0.32 W | 0.16 W/ml |
| 5 | 10 ml | Photoredox Box | 20 ml vial | 450 nm 18W EvoluChem | 0.85 W | 0.08 W/ml |
| 6 | 10 ml | Photoredox Box | 20 ml vial | 425 nm 18W EvoluChem | 0.8 W | 0.08 W/ml |
| 7 | 3 ml | Photoredox Box | 20 ml vial | 425 nm 18W EvoluChem | 0.5 W | 0.2 W/ml |
HepatoChem is committed to providing photon flux data for our photoreactors and accessories to help improve the standard performance and accuracy of photochemical reactions. Please contact us if you are looking for any additional information.
Next Step: See our step by step description of a standard ferrioxalate actinometer protocol to determine photon flux in Hepatochem’s photoreactors using the method and equations described above in this post.
1. H. J. Kuhn, S. E. Braslavsky, and R. Schmidt Chemical Actinometry (IUPAC Technical Report) Pure Appl. Chem., Vol. 76, No. 12, pp. 2105–2146, 2004.
2. Kristine L. Willett and Ronald A. Hites.Chemical Actinometry: Using o-Nitrobenzaldehyde to Measure Lamp Intensity in Photochemical Experiments. Journal of Chemical Education200077 (7), 900 DOI: 10.1021/ed077p900
3. Yining Ji, Daniel A. DiRocco, Cynthia M. Hong, Michael K. Wismer, and Mikhail Reibarkh Facile Quantum Yield Determination via NMR Actinometry Organic Letters 2018 20 (8), 2156-2159 DOI: 10.1021/acs.orglett.8b00391
4. Hatchard C.G.; Parker C.A. A new sensitive chemical actinometer. 2. Potassium ferrioxalate as a standard chemical actinometer. Proc. R. Soc. London, Ser. A. 1956, 235, 518-536.